Assignment story
Introduction
In this part of our research we will find the relation between hapiness and GDP. Moreover, we will find if there is any other link between hapiness score with other variable like social benifit, healthy life expectancy for find the relationship. We use the dataset of world happiness report [1].The dataset includes information from 171 different countries and is categorized into 11 distinct regions.
Story
It’s essential to recognize the elements that fundamentally contribute to happiness in a world where progress and high quality of living standards are being searched for. The complicated relationship between economic prosperity and emotional well-being is highlighted by recent research on global happiness statistics, which shows how these factors connect globally. For this reason we will dive into topic and go on some deep research about the ponit at below. Our main priority will be find some co-relation between hapiness score and the variables are doing this.
The Pursuit of Happiness
Our study mainly looking for some patterns of hapiness around the world, which include the data we collected from the world hapiness data that includes year 2015 to 2023. This dataset provided the yearly data of coutries’ hapiness scores, along with GDP per capita, healthy life expectancy, freedom to make life choices, social support and so on. For now we will compare the average hapiness score with average GDP per capita for each of the countries, we will analysis whether money can buy happiness or not.
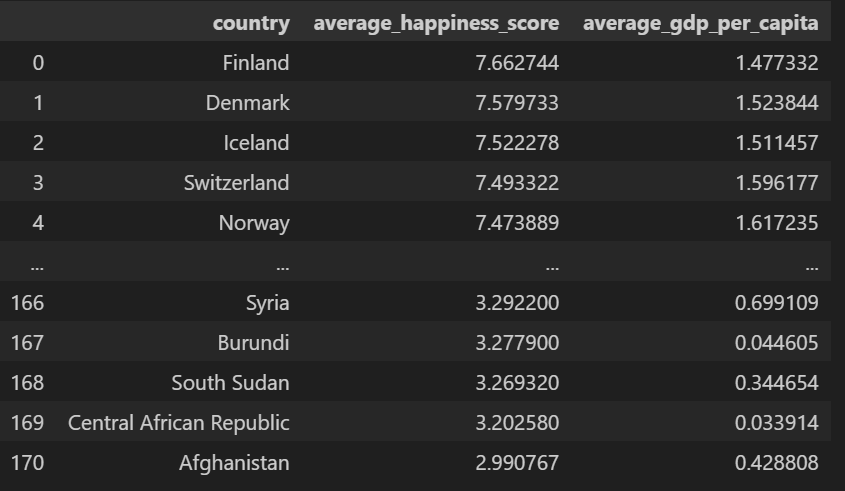 Figure 1: Top five and last five country in the ranking of world hapiest contry in the world.
In the avobe table we can see that Switzerland having the highest average GPD but it is on the number four on the list, whereas, Finland is on the top with just little bit less than that number. More or less we can see that there are some other variables that making this type of fluctuatioon in the position or in the hapiness scores.
At the top of table, Nordic countries like Finland , Denmark and Iceland consistently outline others, because of their best economic performance with high hapiness score. However, there are other countries like Switzerland where GDP per capita is highest among these 5 but they came in the number four because of other factors like comprehensive welfare systems, low corruption levels, and effective social support structures. Now we will look deep down other relations with the other variables with the hapiness score.
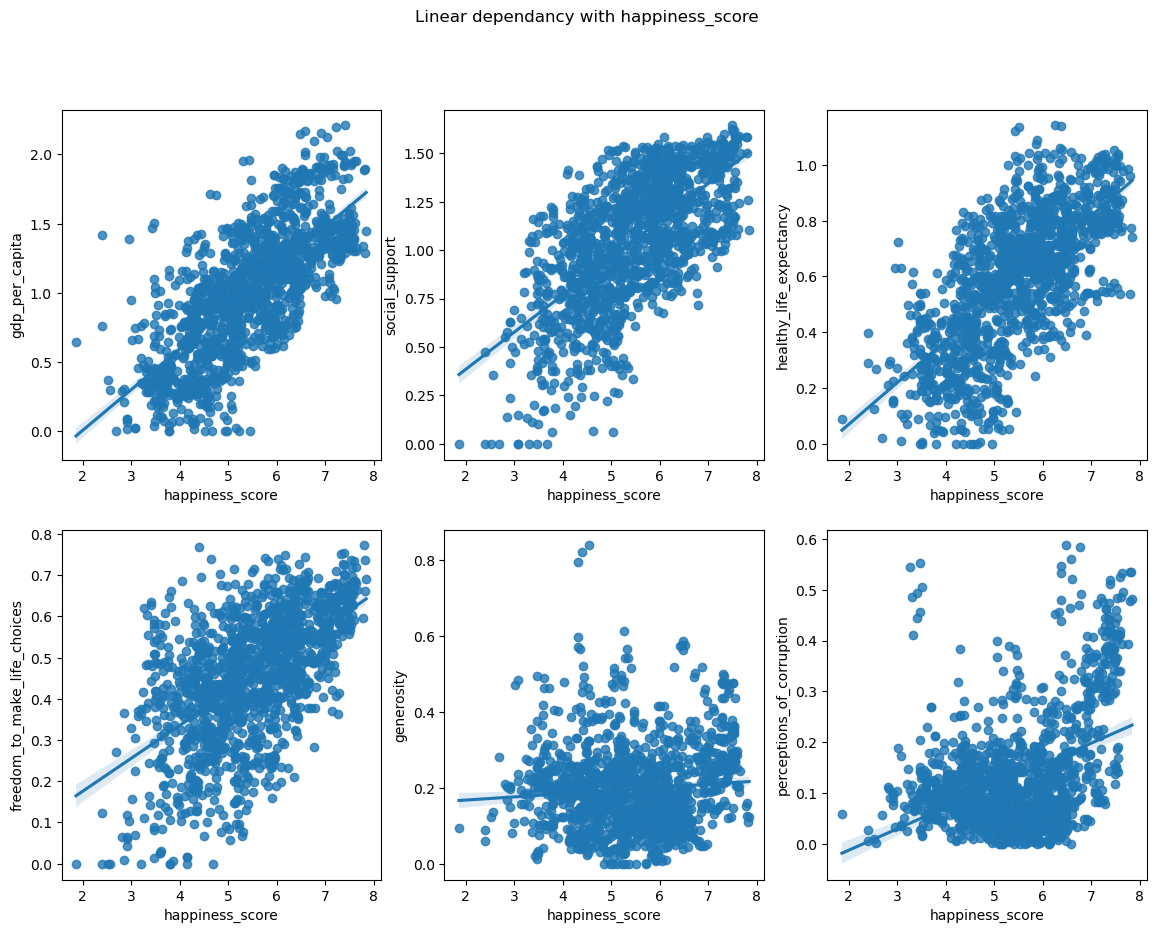 Figure 2: Linear dependencies between Hapiness score vs variables like gdp per capita, perception of corruption, social support, healthy life expectency, generosity.
As we can see like GDP per capita, social support, healthy life expentency and fredom to make life choices have linear dependencies with hapiness score, whereas, we can also say that there are also some outlairs who do not go with this speach. But more or less there are also some of the outlairs they are not following this trend. So there are also some of the factors are unseen in this part of the topic.
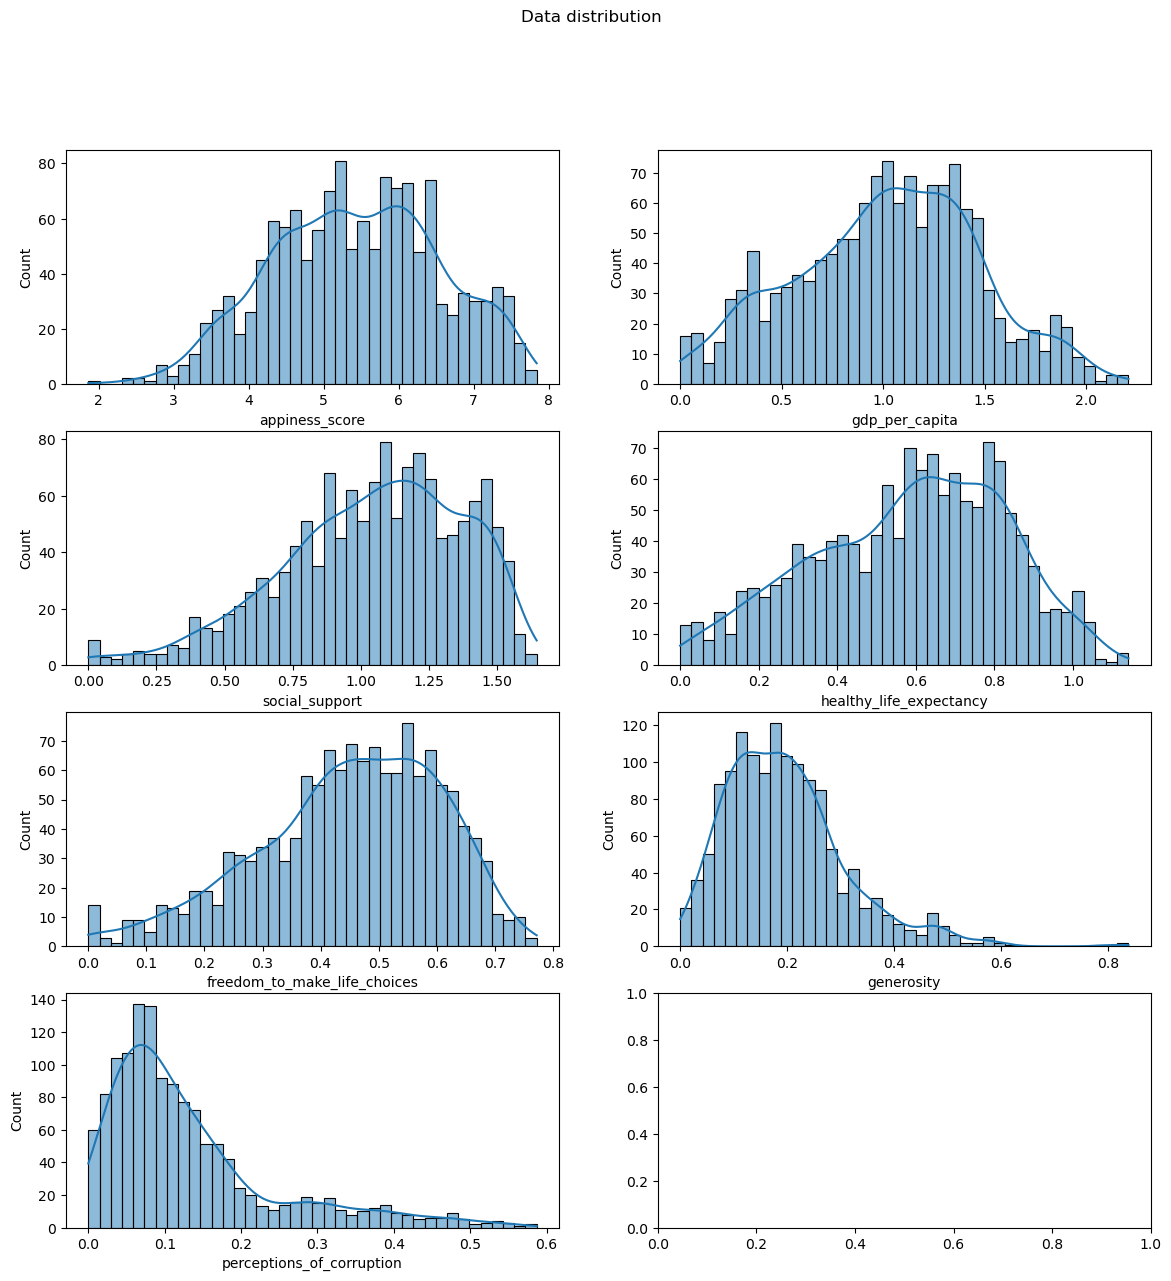 Figure 3: Data Distribution among every vsrisble In our Data set.
As we can see from the distribution of the data every other data is well distributed rather that perception of corouption and genriosity. So we can say that every point of the data set have some influence on the hapiness score and hapiness is not all about money, there are some factors like social support and also GDP per capita does not mean that everybody earn that much money on that particular country it is near an assumption fro the average income of the people of the society.
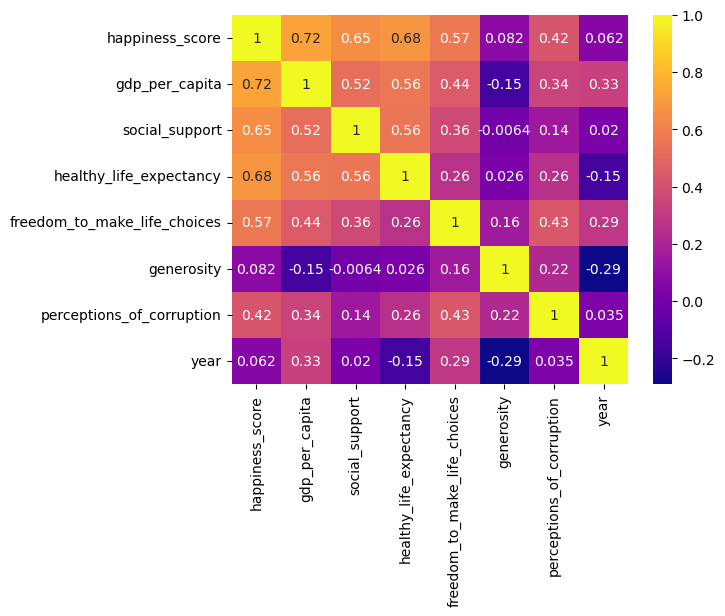 Figure 4: Co-relation Matrix
In the above matrix we can see that GDP per capita has the higest co-relation with the hapiness score, moreover, we can also see that there are some other factor that have strong relation with the hapiness score of our dataset. The data shows that the importance of not just economic growth, but also how wealth is used to promote public welfare and personal freedom.
The lesson to politicians is simple: spending money on social services, health care, and education increases public pleasure. These findings offer researchers and citizens a road map for promoting policies that put people’s welfare ahead of economic growth.
Our Story Journey To World happiest country From Least Happiest Country
Three of us hail from Bangladesh, a developing country. Our experience of living in Bangladesh shows that GDP is a dream covered in copper foil.
Bangladesh faces significant challenges as a developing country. In 2020, about 30 percent of its population, which equates to 50 million people, lived in poverty. Economic disparity is also increasing; from 2010 to 2016, the Gini coefficient, a measure of income inequality, rose from 0.458 to 0.482. According to The Economist, the earnings of the wealthiest households increased by 25%, while that of the poorest households decreased by 33% during this period. Bangladesh must house two million new job seekers joining the labor market every year for the next decade. Further, the country is highly vulnerable to climate shift, ranking as the seventh most at-risk nation globally. These factors combine to offer profound challenges.[2]
Conclusion
In summary, we can say that “Money can buy hapiness” this qoute is not one hundred percent true, although the other this of hapiness we can relate with money. But not all the hapiness come from money, there are lots of other things for people being happy in the soceity.
References:
- Singh, A. (2023) World happiness report 2023, Kaggle. Available at: https://www.kaggle.com/datasets/ajaypalsinghlo/world-happiness-report-2023 (Accessed: 06 May 2024).
- Yusuf, S. (no date) Bangladesh: Growth miracle or Mirage?, Center For Global Development. Available at: https://www.cgdev.org/blog/bangladesh-growth-miracle-or-mirage (Accessed: 06 May 2024).
Notebook Link Note Book Link